Situation Summary
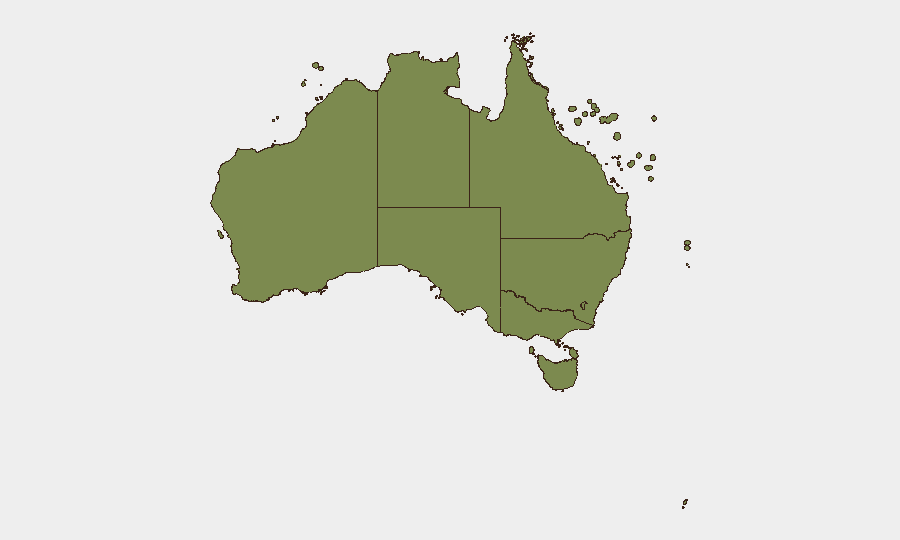
Australia remains a low-threat environment globally (rank #148, composite score 5.0) with 492 tracked security events year-to-date. However, recent developments signal emerging strain across multiple domains: bilateral military friction with Thailand, domestic policy confrontation (indigenous and university statements), and media regulation escalation. The national risk picture is heavily concentrated in New South Wales (32.1) and Victoria (17.4), which together account for the majority of tracked incident activity.
Key Developments
- 2026-06-28 · Thailand–Australia Military Exchange — Reciprocal conventional military force events and arrest/detain actions between Australian and Thai actors (specific locations and operational context not yet clarified in open reporting). This represents the highest-severity signal in the current dataset and warrants urgent clarification of scope and intent.
- 2026-06-28 · Media Regulatory Action — Australian government imposed administrative sanctions against media entities; alignment with social media platform compliance enforcement announced 2026-06-29 suggests a coordinated regulatory campaign.
- 2026-06-27–28 · Domestic Policy Statements — Indigenous groups, university institutions, and general population statements of rejection or opposition directed at government policy; no incidents of violence or disruption reported to date, but sentiment indicators reflect elevated grievance.
- 2026-06-29 · South Australian Rejection Statement — Sub-national rejection by South Australia government; suggests potential inter-jurisdictional policy disagreement or non-compliance with national directives.
Highest-Risk Areas
New South Wales (32.1) and Victoria (17.4) drive the majority of tracked risk, likely reflecting concentrated urban populations, higher reporting density, and cumulative incident volume in Sydney and Melbourne metropolitan areas. Northern Territory (16.4) and Western Australia (11.7) carry secondary risk, potentially reflecting remote infrastructure vulnerability, indigenous land-use tensions, and maritime/border exposure. Tasmania, ACT, and Queensland show markedly lower risk profiles (<5.0 each), consistent with smaller populations and lower incident reporting frequency. The concentration in NSW and Victoria suggests that national-level corporate and government operations face elevated exposure in those jurisdictions.
How GeoBit Would Assist
Network & Actor Analysis would map the entities behind the Thailand military exchange and domestic policy statements to clarify intent, scale, and coordination. AOI Monitoring & Early Warning with persistent watch on NSW (particularly Sydney) and Victoria (Melbourne) would provide 24–48-hour alerting on escalation in media regulation, indigenous action, or cross-border military activity. OSINT Fusion & Corroboration (X/Twitter, Telegram, local news) would disambiguate the Thailand incident and domestic policy signals, separating rhetoric from operational risk. Conflict & Military capabilities would track any force-structure or capability changes signaling preparation for sustained Australia–Thailand tensions.
7-Day Outlook
The Thailand military exchange is the critical signal requiring immediate intelligence clarification; if it reflects operational escalation rather than a localized or training incident, bilateral tensions could accelerate. Domestic policy statements (indigenous, university, population-level) are consistent with periodic governance friction and are not currently indicative of coordinated unrest, but sustained government media sanctions may amplify grievance. The national risk trajectory remains low, but the concentration of activity in NSW and Victoria warrants heightened monitoring of those jurisdictions over the next seven days.
Highest-Risk Areas — Ranked
| # | State / Region | Risk |
|---|---|---|
| 1 | New South Wales | 32.1 |
| 2 | Victoria | 17.4 |
| 3 | Northern Territory | 16.4 |
| 4 | Western Australia | 11.7 |
| 5 | Tasmania | 4.4 |
| 6 | Australian Capital Territory | 3.4 |
| 7 | South Australia | 2.9 |
| 8 | Queensland | 2.5 |
| 9 | Ashmore and Cartier Islands | 2.1 |
| 10 | Jervis Bay Territory | 2.1 |
| 11 | Coral Sea Islands | 2.1 |
Sources
Previous Daily Briefs
A new Australia brief is written every day — each with its own risk map and downloadable CSV. Here's the last week; use the calendar to go further back.
📅 Browse every day by calendar →
Highlighted days have a brief. Tap a day for that day's map & analysis, or “csv” for that day's dataset ($5).