Situation Summary
Australia remains a relatively stable operating environment (rank #139 globally, composite threat score 6), but elevated domestic terrorism concerns and persistent cyber threats are driving current risk posture. Intelligence leadership has publicly highlighted 14 foiled attacks and rising domestic terror threat activity, while cyber incidents affecting 21% of Australian businesses indicate sustained operational risk. New South Wales significantly outranks other states (risk 33.1 vs. 14.5 for Victoria), reflecting concentrated security activity and event density in that jurisdiction.
Key Developments
- 2026-06-30 · National public statement – Australia's intelligence chief issued a formal "grim terror warning," citing successful interdiction of 14 domestic attack plots and underscoring elevated threat posture domestically. (Mainstream coverage via 7News, Sunrise.)
- 2026-06-30 · Government vs. High Court disapproval – Public statement indicating tension between Australian government and High Court, though specific subject and operational impact remain unclear from available signals.
- 2026-06-30 · Corporate sector statement – Public statement involving Australia vs. companies; context and sectoral impact not yet clarified in open reporting.
- 2026-06-28 · Australia–Thailand military and diplomatic events – Multiple signals of conventional military force activity and arrests/detentions between Australian and Thai personnel; public disapproval from Thailand toward Australia. Details of incident scope and resolution status remain limited.
- 2026-06-28 · University and population public statements – Public statements from university and population cohorts toward Australia; operational significance not yet clear from available open-source reporting.
- Ongoing cyber threat escalation (late June reporting) – Cyberattacks on Australian businesses continue to increase in frequency and sophistication (phishing, ransomware). 2024–25 ABS data (released late June) confirm 21% of Australian businesses experienced cyber security incidents, indicating structural risk rather than isolated events.
Highest-Risk Areas
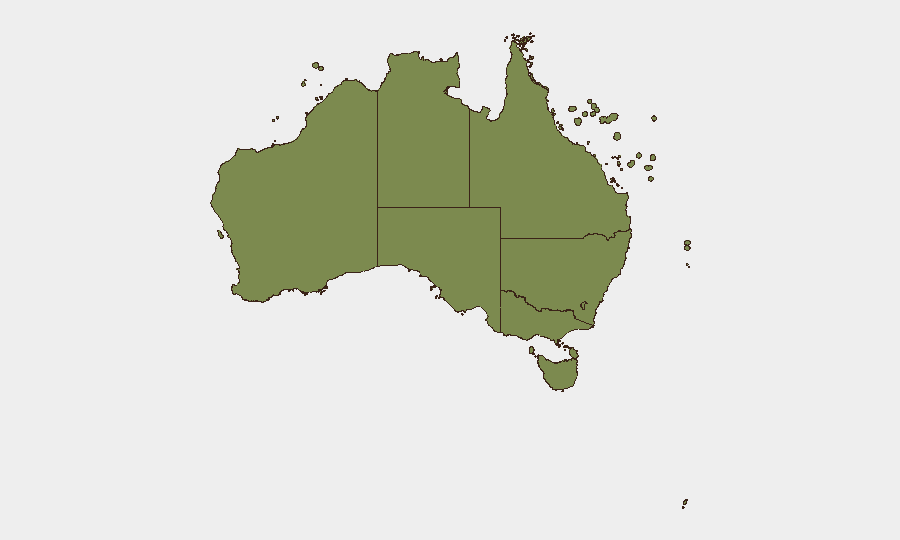
New South Wales dominates the sub-national risk profile (33.1), accounting for roughly 60% of national event density and driving Australia's overall ranking. Victoria and Northern Territory follow at 14.5 and 14.2 respectively, suggesting distributed regional security activity. Queensland, Tasmania, and South Australia carry substantially lower composite scores (5.6, 5, and 4.2), indicating that terrorism, military-diplomatic events, and cyber activity are geographically concentrated in the eastern seaboard and northern regions. Security teams with personnel or assets in NSW should apply heightened situational awareness; Victoria and NT warrant elevated monitoring protocols.
How GeoBit Would Assist
Corporate security teams should deploy AOI Monitoring & Early Warning to track New South Wales continuously, with alert thresholds calibrated to terrorism, cyber, and military-diplomatic event categories. Intel Sweep and OSINT fusion capabilities (X/Twitter, Telegram, YouTube, multi-language search) provide real-time signal correlation on emerging domestic threats, foreign interference, and cyber campaigns. Risk & Threat Assessment and Network & Actor Analysis enable identification of threat actor intent and operational capability, supporting duty-of-care briefings and asset-protection decisions.
7-Day Outlook
Domestic terrorism threat level is expected to remain elevated, with continued law-enforcement interdiction activity likely to generate public statements and operational alerts. Cyber threat activity will persist at structural levels (21% incident prevalence baseline), with targeting of critical sectors and SMBs probable. Australia–Thailand diplomatic and military friction warrants continued monitoring for secondary effects on trade, maritime activity, or personnel safety in either jurisdiction.
Highest-Risk Areas — Ranked
| # | State / Region | Risk |
|---|---|---|
| 1 | New South Wales | 33.1 |
| 2 | Victoria | 14.5 |
| 3 | Northern Territory | 14.2 |
| 4 | Western Australia | 12.9 |
| 5 | Queensland | 5.6 |
| 6 | Tasmania | 5 |
| 7 | South Australia | 4.2 |
| 8 | Australian Capital Territory | 4 |
| 9 | Ashmore and Cartier Islands | 3.1 |
| 10 | Jervis Bay Territory | 3.1 |
| 11 | Coral Sea Islands | 3.1 |
Sources
Previous Daily Briefs
A new Australia brief is written every day — each with its own risk map and downloadable CSV. Here's the last week; use the calendar to go further back.
📅 Browse every day by calendar →
Highlighted days have a brief. Tap a day for that day's map & analysis, or “csv” for that day's dataset ($5).