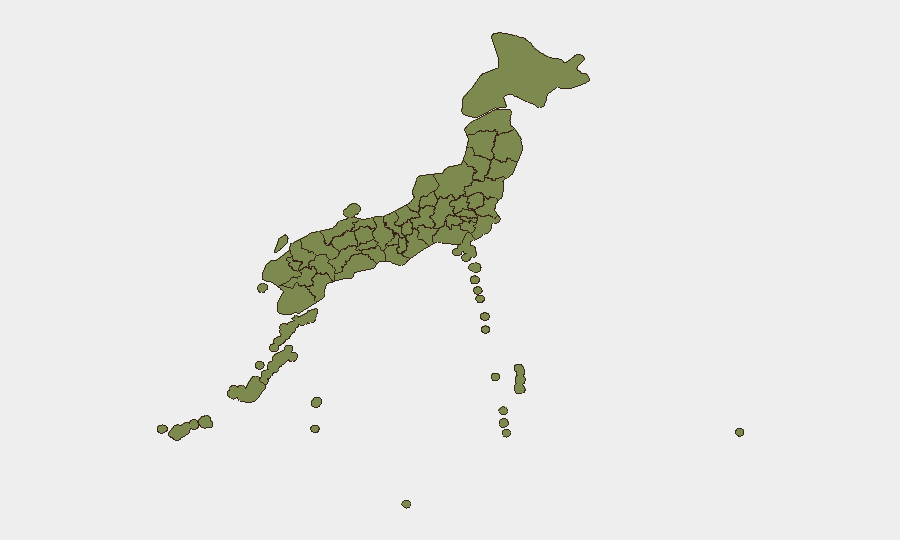
Situation Summary
Japan remains a lower-tier global security risk (rank #110; composite score 9) with 216 tracked events, but acute volatility has emerged in the past 72 hours. Military mobilization, naval activity, and reported conventional force exchanges—coupled with public statements directed at the United States and Brazil—signal a sharp shift in the threat environment. A confirmed cyber breach at Aflac Japan (announced 2026-06-30, affecting systems accessed 2026-06-15 to 2026-06-25) has exposed personal, policy, and banking data, adding operational and reputational risk for multinational insurers and their customers.
Key Developments
- Japan (nationwide) — 2026-06-29: Military mobilization reported; conventional military force activity and naval exchange documented in GeoBit event feeds, with official statements from Japan following. Specifics on force composition, location, and adversary remain unclear from available feeds; escalation trajectory warrants continuous monitoring.
- Tokyo — 2026-06-30: Aflac Japan disclosed a data breach affecting systems accessed between 2026-06-15 and 2026-06-25. Exposed records include personal identifiers, policy numbers, and bank-account details. Organizations with Aflac Japan exposure should prepare breach-response and customer-notification protocols.
- Japan vs. United States — 2026-06-28: Public statement issued; context suggests diplomatic tension or policy disagreement. No kinetic activity reported, but statement timing coincides with military mobilization signals.
- Japan vs. Brazil — 2026-06-29: Public statement issued by Japan; subject and severity not yet corroborated by independent sources.
- Nagano Prefecture — status as of 2026-06-30: Remains the highest-risk sub-national area (composite score 32.5), significantly outpacing all other regions. Driver(s) of elevated risk—whether terrain, infrastructure criticality, or event clustering—require dedicated AOI analysis.
- Tokyo — status as of 2026-06-30: Second-highest risk score (27.3); likely reflects capital-city density, multinational presence, and concentration of critical infrastructure and high-profile targets.
Highest-Risk Areas
Nagano Prefecture and Tokyo account for the majority of tracked risk and require differentiated monitoring. Nagano's score (32.5) is nearly four times that of the third-ranked area (Hiroshima, 8.8), suggesting either a localized incident cluster, ongoing event series, or critical infrastructure concentration; the prefecture's mountainous terrain and transportation corridors (rail, highway) may be factors. Tokyo (27.3) reflects expected capital-region risk: diplomatic missions, financial markets, multinational offices, and transport hubs. The sharp drop-off after these two regions indicates risk is concentrated; peripheral prefectures (Hokkaido, Shizuoka, Saga, Fukuoka, Aichi, Okinawa, Niigata) register scores between 3 and 5, consistent with baseline activity.
How GeoBit Would Assist
Security teams should deploy AOI Monitoring & Early Warning on Nagano and Tokyo to detect escalations in event frequency, location clustering, or actor activity before they affect personnel or assets. Intel Sweep and X/Twitter & Telegram OSINT provide near-real-time signal on military statements, cyber incidents, and public sentiment; sentiment & temporal analysis flags rhetorical shifts suggesting diplomatic or operational escalation. Cyber threat search and entity extraction can map the Aflac breach to supply-chain risk and downstream insurance-customer populations.
7-Day Outlook
The convergence of military mobilization, naval activity, and diplomatic statements suggests heightened state-level tension through at least 2026-07-06. The Aflac breach will likely trigger regulatory scrutiny and customer remediation efforts; secondary targeting of affected organizations for credential harvesting is probable. Organizations should expect continued elevated chatter and monitor Nagano and Tokyo for further clustering before risk naturally subsides or a specific trigger event clarifies intent.
Highest-Risk Areas — Ranked
| # | State / Region | Risk |
|---|---|---|
| 1 | Nagano Prefecture | 32.5 |
| 2 | Tokyo | 27.3 |
| 3 | Hiroshima Prefecture | 8.8 |
| 4 | Kyoto Prefecture | 5.6 |
| 5 | Hokkaido Prefecture | 5 |
| 6 | Saitama Prefecture | 4.4 |
| 7 | Shizuoka Prefecture | 4.2 |
| 8 | Saga Prefecture | 3.3 |
| 9 | Fukuoka Prefecture | 3.3 |
| 10 | Aichi Prefecture | 3.3 |
| 11 | Okinawa Prefecture | 3.1 |
| 12 | Niigata Prefecture | 3.1 |
Sources
Previous Daily Briefs
A new Japan brief is written every day — each with its own risk map and downloadable CSV. Here's the last week; use the calendar to go further back.
📅 Browse every day by calendar →
Highlighted days have a brief. Tap a day for that day's map & analysis, or “csv” for that day's dataset ($5).