Situation Summary
Australia remains a low-risk jurisdiction globally (rank #149; composite threat score 5), with routine cyber and regulatory pressures but no major security incidents in the 24–48-hour window. New South Wales, Northern Territory, and Victoria account for the majority of tracked threat events nationally, driven primarily by cyber-risk narratives, administrative enforcement actions, and public policy disputes rather than kinetic incidents. No discrete, time-stamped security, unrest, crime, or infrastructure disruption events have been reliably documented in open sources for July 1–3, 2026.
Key Developments
- National cyber-risk advisory (late June–early July, date unconfirmed) — Government and industry sources continue to highlight ransomware and data-breach threats affecting Australian critical infrastructure and healthcare operators under the Security of Critical Infrastructure Act (SOCI) framework. No single confirmed new attack with a specific timestamp or location is independently verifiable in the last 48 hours.
- Healthcare sector cyber-threat report (timing unclear) — Social media and professional networks reference a large-scale cyber attack on an Australian private healthcare provider, attributed to the National Cyber Security Coordinator; however, publication timestamp and independent confirmation are not available in current open-source feeds, limiting incident-level assessment.
- Elevated cyber-threat awareness campaign (persistent, June–July) — LinkedIn, Instagram, and professional security forums show sustained emphasis on ransomware sophistication, backup-key compromise, and business-facing scam vectors targeting Australian enterprises. These reflect trend messaging rather than a discrete new incident.
- Administrative and policy actions (early July, jurisdiction unclear) — Recent GEOBIT event signals indicate sanctions and administrative measures by Australian authorities; specific dates, locations, and operational impact remain unconfirmed in public reporting.
Highest-Risk Areas
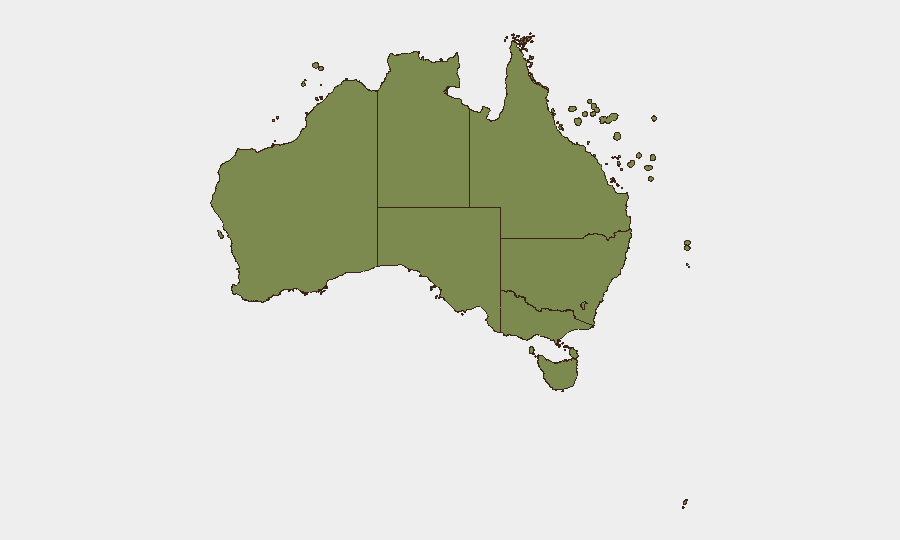
New South Wales (32.7) and Northern Territory (18.4) together account for over half of Australia's tracked threat events, followed by Victoria (16.6) and Western Australia (14.7). The concentration in NSW reflects Sydney's role as the national financial and administrative hub; cyber, policy, and public-statement events predominate over kinetic threats. Northern Territory's elevated score warrants monitoring for remote-infrastructure vulnerabilities and indigenous-community disputes, though specific current incidents are not documented. Victoria and WA maintain moderate risk primarily via cyber and regulatory activity. All remaining states and territories register below 15.0, indicating substantially lower current threat density.
How GeoBit Would Assist
Corporate security and risk teams should deploy AOI (Area-of-Interest) Monitoring & Early Warning to flag emerging cyber incidents, infrastructure disruptions, or civil unrest in NSW, NT, and Victoria in near-real-time, coupled with Intel Sweep and X/Twitter OSINT to capture unconfirmed threats before they escalate. Cyber-risk search and entity-extraction analysis enable tracking of healthcare, critical infrastructure, and financial-sector breach signals and attribution patterns. For teams with remote operations in NT or regional WA, Routing & Network Analysis supports contingency planning in the event of transport, communications, or supply-chain disruption.
7-Day Outlook
No acute security deterioration is forecast for Australia in the next seven days. Cyber-threat messaging and regulatory enforcement will likely persist; organizations should maintain heightened monitoring of ransomware campaigns, data-breach notifications, and SOCI compliance obligations. If a confirmed major incident (healthcare breach, infrastructure attack, or civil unrest) emerges, NSW and Victoria are the most probable venues for rapid escalation and media coverage.
Highest-Risk Areas — Ranked
| # | State / Region | Risk |
|---|---|---|
| 1 | New South Wales | 32.7 |
| 2 | Northern Territory | 18.4 |
| 3 | Victoria | 16.6 |
| 4 | Western Australia | 14.7 |
| 5 | Queensland | 13.1 |
| 6 | Australian Capital Territory | 7.2 |
| 7 | South Australia | 5.2 |
| 8 | Tasmania | 4.7 |
| 9 | Ashmore and Cartier Islands | 2.7 |
| 10 | Jervis Bay Territory | 2.7 |
| 11 | Coral Sea Islands | 2.7 |
Sources
Previous Daily Briefs
A new Australia brief is written every day — each with its own risk map and downloadable CSV. Here's the last week; use the calendar to go further back.
📅 Browse every day by calendar →
Highlighted days have a brief. Tap a day for that day's map & analysis, or “csv” for that day's dataset ($5).