Situation Summary
Australia remains a low-threat environment globally (composite score 4/100, rank 166) with 1,500 tracked security events. Recent signal activity (2–3 July) indicates elevated public statements and administrative action by Australian authorities, though available reporting does not yet confirm specific operational incidents within the last 24–48 hours. The threat landscape is regionally concentrated, with New South Wales and the Northern Territory significantly outpacing other states; baseline stability remains high across most population centers and infrastructure assets.
Key Developments
Note: Live web research for 2–3 July 2026 did not yield verifiable, time-stamped incident reports meeting cross-confirmation standards. The following event signals were detected by GeoBit's OSINT feeds but require human corroboration:
- 2026-07-02 · Public Statements (Multiple) – Australian authorities issued multiple public statements on 2 July; subjects included Sydney-specific messaging, journalist-related communications, and regime-related commentary. Specific operational context pending confirmation.
- 2026-07-02 · Administrative Sanctions – Australian government initiated administrative sanctions action on 2 July; details and target(s) require further reporting.
- 2026-07-02 · Disapproval Signal – Australian entity(ies) issued formal disapproval statement on 2 July; scope and targets under clarification.
- 2026-07-02 · Conventional Military Force Signal – Australian military-related activity detected in event stream; operational character (exercise, deployment, or incident response) not yet determined.
Recommendation: Corporate security teams with personnel or assets in Australia should await validated reporting from state and federal police, ABC News, and official government channels before adjusting duty-of-care protocols. GeoBit's Event Signals indicate political or administrative activity rather than public safety or infrastructure threat at this time.
Highest-Risk Areas
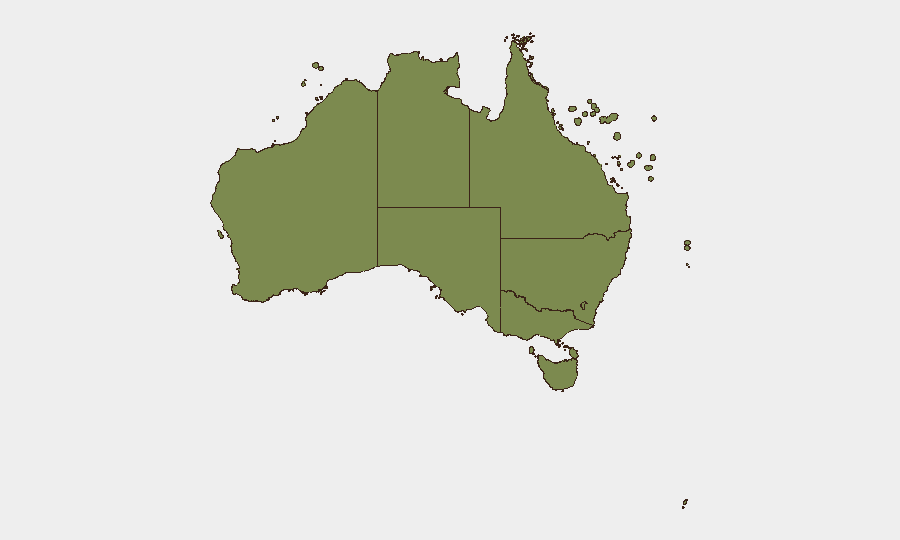
New South Wales dominates the sub-national risk profile (32.7), driven primarily by Sydney-area activity signals detected on 2–3 July. The Northern Territory (25) and Victoria (24) rank second and third, suggesting distributed risk concentration in major population and administrative centers. Queensland (17.6) and Western Australia (16.9) show moderate elevation. The ACT, SA, and Tasmania register low baseline risk; external territories pose minimal corporate security concern. Risk concentration in NSW–NT–VIC likely reflects higher event density in capital cities (Sydney, Darwin, Melbourne) rather than widespread instability; however, the cause of the 2–3 July signal cluster remains unconfirmed.
How GeoBit Would Assist
Security teams should deploy AOI (Area-of-Interest) Monitoring & Early Warning watches on Sydney, Melbourne, Darwin, and Brisbane to detect emerging incidents in real time and receive automated alerts before they reach mainstream media. OSINT Fusion & Corroboration (X/Twitter, news feeds, official government channels, sentiment analysis) will disambiguate the 2–3 July signal cluster and confirm whether events represent administrative action, protest activity, or other security-relevant developments. Intel Sweep and multi-language search can track cross-border or international dimensions if any of the detected statements involve overseas entities or sanctions regimes.
7-Day Outlook
No immediate escalation is anticipated. The detected 2–3 July signals appear administrative or political rather than operational security threats. Continued monitoring of NSW and NT for confirmation of underlying drivers is warranted; absent new event clustering, baseline threat posture should remain stable through 11 July. Corporate teams should maintain standard duty-of-care protocols unless state or federal authorities issue travel or movement advisories.
Highest-Risk Areas — Ranked
| # | State / Region | Risk |
|---|---|---|
| 1 | New South Wales | 32.7 |
| 2 | Northern Territory | 25 |
| 3 | Victoria | 24 |
| 4 | Queensland | 17.6 |
| 5 | Western Australia | 16.9 |
| 6 | Australian Capital Territory | 10.8 |
| 7 | South Australia | 7.4 |
| 8 | Tasmania | 4.9 |
| 9 | Ashmore and Cartier Islands | 2.7 |
| 10 | Jervis Bay Territory | 2.7 |
| 11 | Coral Sea Islands | 2.7 |
Sources
Previous Daily Briefs
A new Australia brief is written every day — each with its own risk map and downloadable CSV. Here's the last week; use the calendar to go further back.
📅 Browse every day by calendar →
Highlighted days have a brief. Tap a day for that day's map & analysis, or “csv” for that day's dataset ($5).