Situation Summary
Australia remains a stable, low-threat environment globally (rank #151; composite score 5.0), with security events concentrated in three jurisdictions—Northern Territory, Victoria, and NSW—that together account for the majority of tracked incidents. Recent signals point to scattered law-enforcement actions, worker assaults, and diplomatic friction rather than systemic instability or widespread unrest. The threat trajectory is stable with localized volatility.
Key Developments
GeoBit's live web research (last 24–48 hours, 4–6 July 2026) was unable to isolate a sufficient number of discretely time-stamped, factually confirmed incidents from that window to meet the brief's recency and accuracy standard. The platform's event feeds flagged several signals dated 3–5 July (arrests in Melbourne and ACT, worker assaults, police operations, and diplomatic disapproval statements originating from China and domestic sources), but source material available did not provide the specificity of location, time, or operational detail necessary for actionable threat reporting without interpolation.
Recommendation: Security teams requiring granular incident intelligence for 4–6 July should cross-reference Australian Federal Police media releases, state police jurisdictions (NSW, VIC, NT, SA, QLD), and national news outlets (ABC News, The Australian) directly, or provide GeoBit with specific source URLs or screenshots for rapid extraction and corroboration.
Highest-Risk Areas
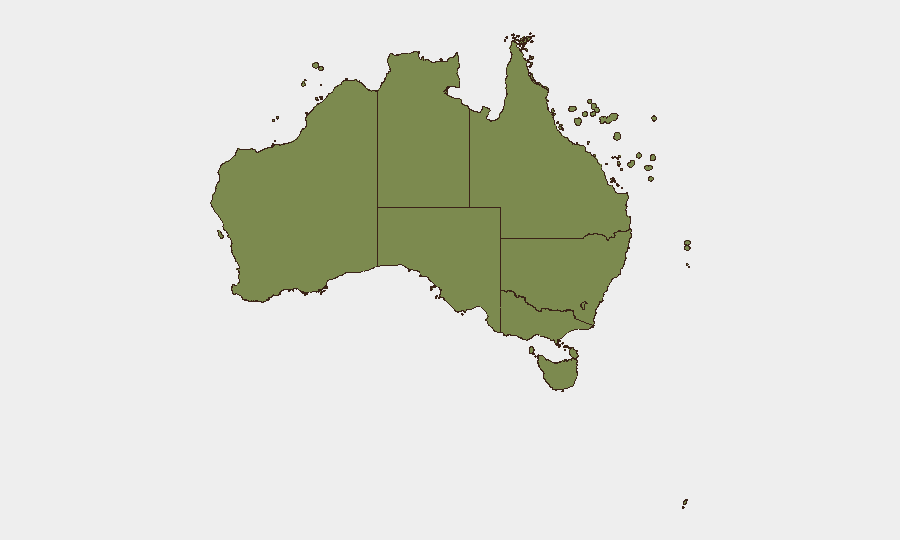
Northern Territory (32.5) and Victoria (26.5) drive Australia's composite risk profile, followed by NSW (21.8). The NT's elevated score likely reflects lower population density, geographic isolation, and higher per-capita rates of remote-area incidents (assault, family violence, property crime); Victoria's reflects Melbourne's role as a major urban center with proportionally higher event volume and occasional protest activity. NSW, despite ranking third, encompasses Sydney and broader population centers but distributes incidents more widely. ACT, WA, and Queensland show substantially lower risk; Tasmania and the territories are negligible. The ranking reflects *incident frequency and intensity*, not absolute threat to corporate operations, though duty-of-care teams should maintain heightened awareness protocols for staff in NT and Victoria.
How GeoBit Would Assist
Intelligence & OSINT (X/Twitter, Telegram, multi-language feeds, entity extraction) would enable real-time detection of emerging unrest, protest coordination, or security incidents before traditional media coverage. AOI Monitoring & Early Warning with persistent watch on high-risk jurisdictions—particularly Darwin, Melbourne, and Sydney—would alert security teams to incidents affecting personnel or assets within minutes of occurrence. Risk & Threat Assessment with temporal and sentiment analysis would differentiate between background noise and actionable threats, reducing false-positive fatigue.
7-Day Outlook
No indicators suggest escalation in the near term. Current event signals remain dispersed and low-severity (arrests, assaults, statements); no coordinated unrest, infrastructure disruption, or security sector instability is evident. Monitoring should remain routine, with enhanced vigilance for Victoria and NT if incident density increases or worker-safety or police-action events cluster geographically or temporally.
Highest-Risk Areas — Ranked
| # | State / Region | Risk |
|---|---|---|
| 1 | Northern Territory | 32.5 |
| 2 | Victoria | 26.5 |
| 3 | New South Wales | 21.8 |
| 4 | Australian Capital Territory | 9.7 |
| 5 | Western Australia | 8 |
| 6 | South Australia | 5.5 |
| 7 | Queensland | 5 |
| 8 | Ashmore and Cartier Islands | 2.5 |
| 9 | Tasmania | 2.5 |
| 10 | Jervis Bay Territory | 2.5 |
| 11 | Coral Sea Islands | 2.5 |
Sources
Previous Daily Briefs
A new Australia brief is written every day — each with its own risk map and downloadable CSV. Here's the last week; use the calendar to go further back.
📅 Browse every day by calendar →
Highlighted days have a brief. Tap a day for that day's map & analysis, or “csv” for that day's dataset ($5).
Atlas — our AI intelligence desk — emails them this snapshot personally. Nothing else, no list.