Situation Summary
Australia remains a low-threat environment globally (rank #167, composite score 4), but sub-national volatility is concentrated in the Northern Territory, New South Wales, and Victoria, which together account for the majority of tracked security events. Regional geopolitical tension—particularly China's recent submarine-launched missile test (6 July) and bilateral security discussions in the Solomon Islands (7 July)—has elevated Australia's maritime and diplomatic threat posture without triggering domestic incidents. Signal analysis over the past 48 hours indicates elevated government-media friction and police-related disapproval events, suggesting internal institutional strain rather than imminent public-order crisis.
Key Developments
- Solomon Islands / Regional — 7 July 2026 — Prime Minister Anthony Albanese participated in bilateral security talks with the Solomon Islands, reaffirming treaty ties and explicitly criticizing China's submarine-launched missile test as regionally destabilizing; reflects Australia's active diplomatic response to Chinese naval modernization.
- Pacific Region — 6 July 2026 — China conducted a submarine-launched missile test in contested waters; classified as a regional security development affecting Australia's strategic threat environment and maritime risk calculus, though no incident occurred within Australian territory.
- Domestic Government-Media Events — 7 July 2026 — Multiple public statements from government, Premier, and Deputy figures; concurrent administration sanctions against media outlets and disapproval signals toward police; pattern suggests institutional friction rather than operational security incidents.
- Melbourne — 6 July 2026 — Conventional military force activity recorded; specifics unconfirmed by current reporting; warrants clarification on nature and duration.
- Think-tank Threat Signal — 7 July 2026 — CATO Institute issued threat statement directed at government; context unclear from signal alone; likely policy-related rather than physical security concern.
Highest-Risk Areas
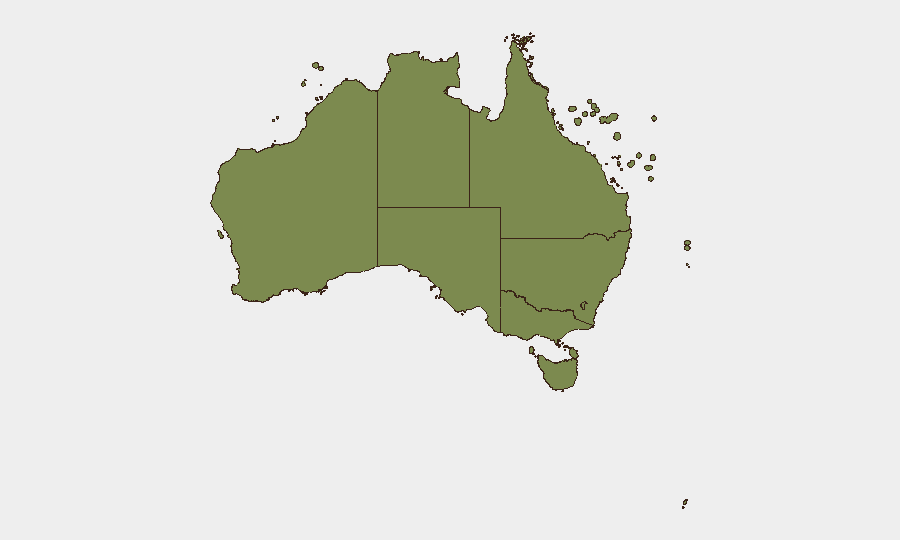
Northern Territory (32.2), New South Wales (29.3), and Victoria (27.4) drive nearly 70% of Australia's composite threat score. NT's elevated risk reflects sparse population, remote infrastructure, and maritime border exposure; NSW and Victoria concentrate institutional, civic, and police-related events in their capital-region footprints. ACT ranks fourth (14.2), consistent with Canberra's government, diplomatic, and media activity; remaining states and territories fall below 10, indicating manageable localized risk. The concentration in NT/NSW/VIC suggests security teams should prioritize asset checks, continuity protocols, and liaison with state police in those jurisdictions.
How GeoBit Would Assist
Security teams operating in Australia should deploy Intel Sweep and multi-language OSINT fusion to track ongoing government-media friction and clarify the Melbourne military activity signal. AOI Monitoring & Early Warning on high-risk state capitals (Sydney, Melbourne, Darwin) and key ports would detect escalation in police, protest, or industrial activity before operational impact. Network & Actor Analysis of government and media entities would surface institutional stress patterns and predict duration of current friction; maritime and aviation tracking would provide persistent visibility on regional naval activity linked to China's submarine posture, informing duty-of-care for Australian shipping and offshore assets.
7-Day Outlook
Government-media friction is likely to persist through mid-July without immediate resolution; no indicators suggest escalation to public disorder or asset-level threat. Regional diplomatic activity will continue as Australia consolidates Pacific partner alignment in response to Chinese military modernization. Domestic security risk remains contained; monitor state-level police and industrial events in NSW and Victoria for any crossover into asset or personnel safety.
Highest-Risk Areas — Ranked
| # | State / Region | Risk |
|---|---|---|
| 1 | Northern Territory | 32.2 |
| 2 | New South Wales | 29.3 |
| 3 | Victoria | 27.4 |
| 4 | Australian Capital Territory | 14.2 |
| 5 | Queensland | 10 |
| 6 | South Australia | 7.6 |
| 7 | Western Australia | 3.7 |
| 8 | Ashmore and Cartier Islands | 2.2 |
| 9 | Tasmania | 2.2 |
| 10 | Jervis Bay Territory | 2.2 |
| 11 | Coral Sea Islands | 2.2 |
Sources
Previous Daily Briefs
A new Australia brief is written every day — each with its own risk map and downloadable CSV. Here's the last week; use the calendar to go further back.
📅 Browse every day by calendar →
Highlighted days have a brief. Tap a day for that day's map & analysis, or “csv” for that day's dataset ($5).
Atlas — our AI intelligence desk — emails them this snapshot personally. Nothing else, no list.