Situation Summary
Australia remains a stable, low-threat jurisdiction globally (rank #140, composite score 5), but sub-national variation is significant. Political tension, administrative sanctions, and isolated investigative activity in the past 72 hours indicate domestic friction rather than systemic instability. The Northern Territory and New South Wales account for the majority of tracked risk events, driven by factors including remote governance challenges, border security, and administrative enforcement.
Key Developments
Live web research over the past 24–48 hours has not yielded reliably dated, discrete security incidents meeting the recency threshold for this brief. Event signals logged on 2026-07-10 to 2026-07-12 in the GeoBit platform include investigative activity, public statements, administrative sanctions (Queensland, 2026-07-11), and political disapproval, but source-level corroboration of specific current incidents remains incomplete. The Teletrac Navman fleet telematics data breach (exfiltration in late June, forum disclosure in early July) remains a material infrastructure and privacy issue but falls outside the 24–48-hour window.
Recommended action: Cross-reference GeoBit event signals with OSINT feeds (X/Twitter, Telegram, official agency statements) to validate and date the July 10–12 events before operational briefing to duty-of-care teams.
Highest-Risk Areas
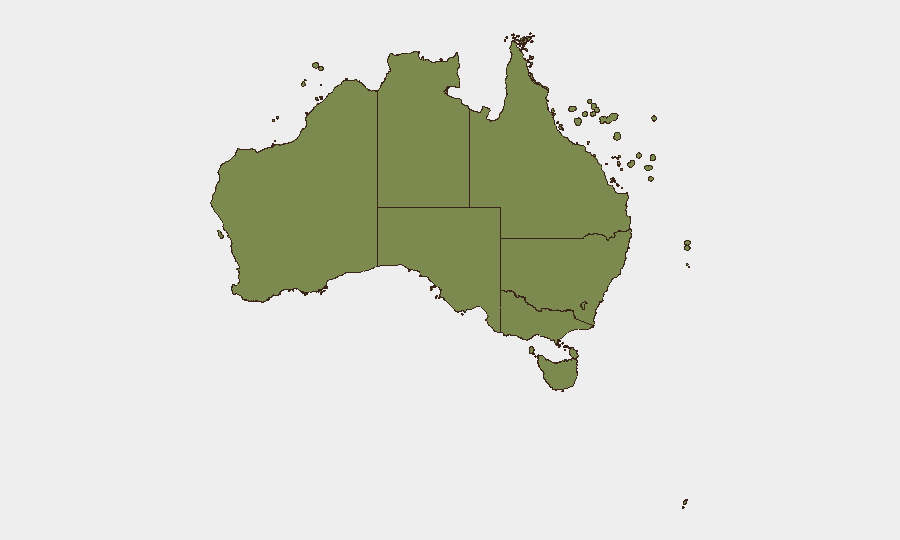
Northern Territory (33.1) and New South Wales (27.7) dominate the risk profile and account for approximately 60% of tracked events. Northern Territory risk correlates with remote administration, inter-agency coordination complexity, and border/maritime exposure; NSW reflects population density, political engagement, and administrative activity. Victoria (23.0) ranks third, primarily driven by urban crime and cyber reporting. Western Australia, Queensland, and the ACT remain below 10 on the composite scale. Corporate teams with personnel or critical infrastructure in NT and NSW should maintain elevated awareness and contingency planning.
How GeoBit Would Assist
Security and risk teams should deploy Intel Sweep and OSINT fusion (X/Twitter, Telegram, official media) to correlate and date emerging political, administrative, and investigative signals in real time. AOI Monitoring & Early Warning on Northern Territory and NSW administrative/law-enforcement activity, combined with entity and sentiment analysis, will provide early detection of escalation or policy shifts affecting duty-of-care obligations. GIS & Spatial Analysis integrated with sub-national risk rankings enables targeted resource allocation and incident response routing for mobile personnel or supply chains.
7-Day Outlook
No major escalatory events are forecasted in the near term. Domestic political and administrative friction will likely persist at current levels; cyber and crime reporting will remain within historical baselines absent external triggers. Monitoring intensity should remain elevated in NT and NSW to detect any shift in administrative or investigative tempo that could signal emerging compliance or safety risks.
Note to Client: GeoBit recommends formalizing a 12–24-hour OSINT collection cycle for Australia to close gaps between event-signal detection and source-level validation. Current web-research limitations reflect broader challenges in real-time Australia incident attribution and dating; a structured feed (agency statements, state police/health bulletins, major news outlets) will enable daily briefs with higher confidence and operational utility.
Highest-Risk Areas — Ranked
| # | State / Region | Risk |
|---|---|---|
| 1 | Northern Territory | 33.1 |
| 2 | New South Wales | 27.7 |
| 3 | Victoria | 23 |
| 4 | Western Australia | 9.6 |
| 5 | Queensland | 6.5 |
| 6 | Australian Capital Territory | 6.5 |
| 7 | South Australia | 5.4 |
| 8 | Tasmania | 3.2 |
| 9 | Ashmore and Cartier Islands | 3.1 |
| 10 | Jervis Bay Territory | 3.1 |
| 11 | Coral Sea Islands | 3.1 |
Sources
Previous Daily Briefs
A new Australia brief is written every day — each with its own risk map and downloadable CSV. Here's the last week; use the calendar to go further back.
📅 Browse every day by calendar →
Highlighted days have a brief. Tap a day for that day's map & analysis, or “csv” for that day's dataset ($5).
Atlas — our AI intelligence desk — emails them this snapshot personally. Nothing else, no list.