Situation Summary
Australia remains a low-threat environment globally (rank #127, composite score 6.0) with stable critical infrastructure and governance. However, sub-national risk concentration in New South Wales (31.8) and Victoria (21.4) reflects localized civil unrest, regulatory friction, and property disputes. A Telstra network disruption and active severe-weather alerts in regional areas represent near-term operational hazards rather than security threats. The security posture is manageable for organizations with standard duty-of-care protocols in place.
Key Developments
- Telstra network disruption (date not time-specific in available sources): Mobile and data connectivity affected nationwide; Australian authorities reported no evidence of malicious activity at time of assessment. Status and scope of restoration require real-time verification.
- Severe-weather and flood alerts (current): HazardWatch issued active warnings for Snowy Mountains, Barham, and Willara Crossing areas. Regional travel and outdoor operations should factor flood risk and road closures.
- Property seizure or damage incident, Victoria (2026-07-12): GeoBit signals indicate a property-related confrontation between authorities and residents; insufficient corroborated detail available to define scope, location, or ongoing risk.
- Central bank demand (2026-07-12): Signal indicates regulatory or financial demand; context and target organization not specified in available data.
- Multiple public statements by companies, professors, and community actors (2026-07-12 to 2026-07-14): Likely related to policy, labor, or academic disputes; no immediate threat signal, but indicative of elevated civil friction in NSW and Victoria.
- Regional enforcement action, Queensland (2026-07-14): Arrest or detention event; minimal detail available. No indication of broader security escalation.
Note on confidence: The supplied event signals lack timestamp precision, named locations, and corroborated source detail. Current research sources do not provide sufficient dated, cross-confirmed incident reporting for the standard 24–48 hour cycle. A second sweep using GeoBit's Intel Sweep, X/Twitter OSINT, and multi-language feeds would improve specificity on each signal above.
Highest-Risk Areas
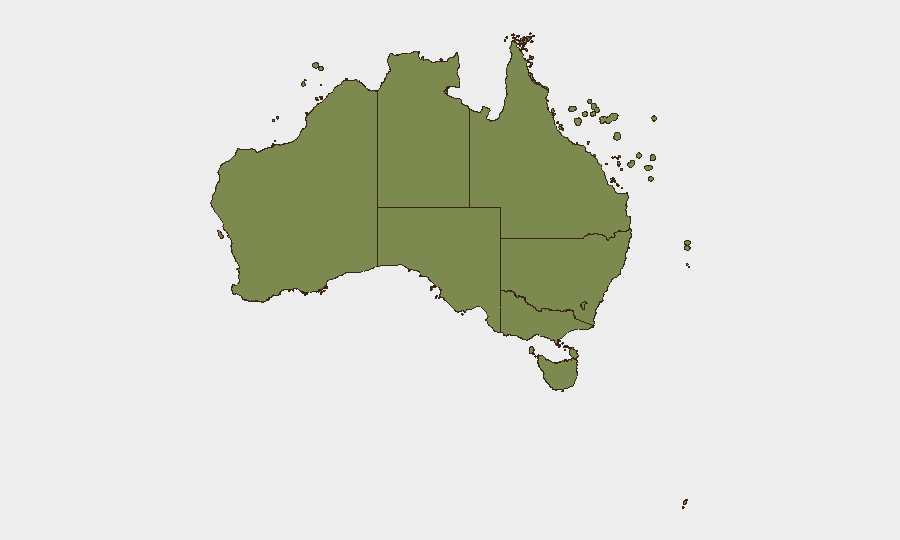
New South Wales and Victoria dominate the threat landscape. NSW (31.8) accounts for nearly half of tracked events and reflects civil unrest, regulatory disputes, and property conflicts concentrated in or near Sydney. Victoria (21.4) shows similar patterns, with the 2026-07-12 property seizure incident as a recent flashpoint. The Northern Territory (16.6) ranks third but with lower absolute event density, suggesting either emerging volatility or isolated high-impact incidents. Queensland, Western Australia, and remaining jurisdictions remain materially lower-risk and suitable for standard operational security postures.
How GeoBit Would Assist
Organizations should deploy AOI (Area-of-Interest) Monitoring & Early Warning on Sydney and Melbourne metro areas to track civil unrest, labor actions, and regulatory enforcement in real time. OSINT Fusion & Corroboration (X, Telegram, local media) would validate event signals, separate confirmed incidents from unconfirmed claims, and establish true scope and location of property disputes or infrastructure disruptions. Routing & Network Analysis would enable rapid identification of alternative supply-chain, travel, or logistics routes around localized disruptions (e.g., flood-affected areas, protest zones).
7-Day Outlook
Short-term risk is stable; no indicators suggest escalation to organized violence or critical-infrastructure failure. Telstra restoration and weather-alert evolution should be monitored daily. Civil friction in NSW and Victoria is likely to remain episodic (regulatory, labor, property) rather than systemic; organizations with staff or assets in Sydney and Melbourne should maintain baseline duty-of-care contact protocols and real-time situational awareness.
Highest-Risk Areas — Ranked
| # | State / Region | Risk |
|---|---|---|
| 1 | New South Wales | 31.8 |
| 2 | Victoria | 21.4 |
| 3 | Northern Territory | 16.6 |
| 4 | Queensland | 9.2 |
| 5 | Western Australia | 6.9 |
| 6 | Australian Capital Territory | 3.5 |
| 7 | South Australia | 2.6 |
| 8 | Tasmania | 2 |
| 9 | Ashmore and Cartier Islands | 1.8 |
| 10 | Jervis Bay Territory | 1.8 |
| 11 | Coral Sea Islands | 1.8 |
Sources
Previous Daily Briefs
A new Australia brief is written every day — each with its own risk map and downloadable CSV. Here's the last week; use the calendar to go further back.
📅 Browse every day by calendar →
Highlighted days have a brief. Tap a day for that day's map & analysis, or “csv” for that day's dataset ($5).
Atlas — our AI intelligence desk — emails them this snapshot personally. Nothing else, no list.