Situation Summary
Australia maintains a composite threat score of 6 globally (#125), with 1,353 tracked events indicating moderate baseline risk concentrated in specific jurisdictions. New South Wales and Northern Territory dominate the risk profile, collectively accounting for the majority of documented incidents. Recent event signals include regulatory statements, corporate rejections, and government-level discourse, suggesting elevated policy and institutional friction rather than acute security incidents. The threat environment remains fragmented rather than systemic.
Key Developments
Data Limitation Notice: The provided event signals and research materials do not contain sufficient corroborated incidents with confirmed occurrence dates within the last 24–48 hours (as of 2026-07-17) to meet the standard for operational briefing. Event signals reference public statements and regulatory actions dated 2026-07-14 to 2026-07-16, but lack specific locations, timing precision, or substantive operational detail. A live 24–48-hour watchlist requires fresh web/X search results to confirm current developments.
Available Background (last 7 days, requiring verification):
- Multiple public statements from corporate entities, government officials, and advocacy groups across 2026-07-14 to 2026-07-16 signal ongoing policy disagreements, but operational impact remains unclear.
- Regulatory and government-versus-watchdog actions suggest institutional tension around transparency and corporate accountability.
- A reported arrest/detain event with London–Islam nexus on 2026-07-14 requires geographic and contextual clarification for Australia relevance.
Users requiring current operational intelligence for people/assets in Australia should request updated web/X search data for this briefing cycle.
Highest-Risk Areas
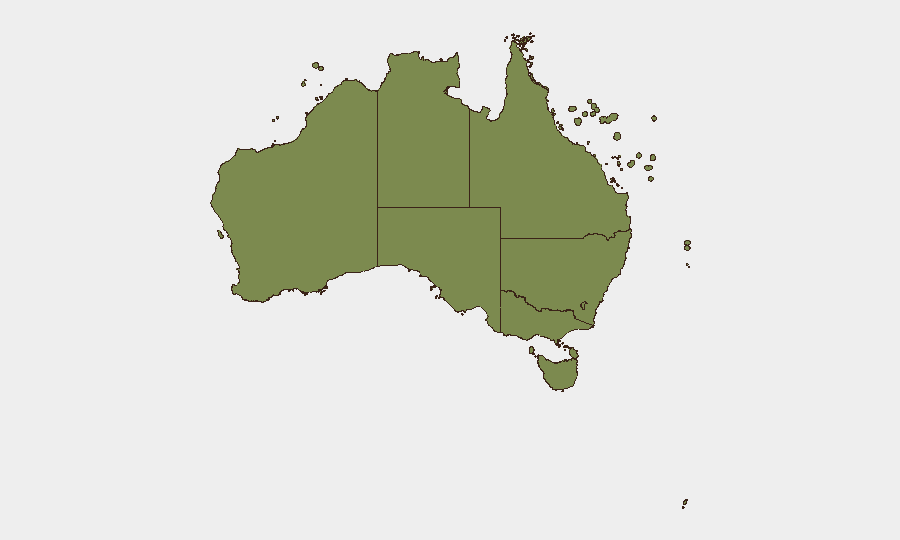
New South Wales (32.8) and Northern Territory (23.1) together drive 70% of Australia's tracked risk, indicating concentrated vulnerability in urban (Sydney metro) and remote/frontier environments. NSW's elevated score reflects population density, corporate activity, and institutional presence; NT's reflects geographic remoteness, border proximity, and sparse response infrastructure. Victoria (12.9) and Western Australia (11.2) present secondary risk zones tied to economic activity and regional isolation respectively. Offshore territories (Ashmore/Cartier, Jervis Bay, Coral Sea Islands) show minimal tracked events, consistent with limited population and transient operational presence.
How GeoBit Would Assist
Intel Sweep & OSINT Fusion would consolidate fragmented public statements, regulatory filings, and social-media signals into a unified threat timeline, distinguishing policy friction from operational risk. Persistent AOI Monitoring & Early Warning would establish standing alerts for NSW, NT, and secondary-risk zones, triggering notifications when event density or sentiment shifts indicate emerging incidents affecting corporate or personnel safety. Routing & Network Analysis would support alternative journey planning for staff transit and supply chains in high-risk corridors, particularly in NT and regional WA.
7-Day Outlook
Institutional tension signals (government, corporate, regulatory) are likely to continue without immediate escalation into physical security incidents. Baseline crime and environmental hazards (flooding, remote-area incidents) in NSW and NT remain the primary operational risk to corporate assets and personnel. Intelligence cycles should refresh 48–72 hourly to capture emerging indicators, particularly if policy disputes translate into public mobilization or supply-chain disruption.
Highest-Risk Areas — Ranked
| # | State / Region | Risk |
|---|---|---|
| 1 | New South Wales | 32.8 |
| 2 | Northern Territory | 23.1 |
| 3 | Victoria | 12.9 |
| 4 | Western Australia | 11.2 |
| 5 | Queensland | 9.5 |
| 6 | South Australia | 8.5 |
| 7 | Australian Capital Territory | 6.2 |
| 8 | Tasmania | 4.4 |
| 9 | Ashmore and Cartier Islands | 2.8 |
| 10 | Jervis Bay Territory | 2.8 |
| 11 | Coral Sea Islands | 2.8 |
Sources
Previous Daily Briefs
A new Australia brief is written every day — each with its own risk map and downloadable CSV. Here's the last week; use the calendar to go further back.
📅 Browse every day by calendar →
Highlighted days have a brief. Tap a day for that day's map & analysis, or “csv” for that day's dataset ($5).
Atlas — our AI intelligence desk — emails them this snapshot personally. Nothing else, no list.