Situation Summary
Australia's composite threat score of 21 places it in the lower-to-moderate range globally, with 389 tracked events over the assessment period. However, sub-national concentration is pronounced: New South Wales alone accounts for a risk score nearly double that of Queensland, suggesting concentrated civil-political tensions rather than distributed instability. Recent signals point to indigenous grievances, government rejection dynamics, and community-company friction, though the scale and immediacy of these signals remain to be verified against ground reporting.
Key Developments
Unable to confirm specific incidents within the last 24–48 hours with the required confidence threshold. Live web research has not yielded time-stamped, location-specific security events for 24–25 July 2026 that can be independently verified. The event signals listed above (drawn from the GEOBIT platform) indicate thematic clusters—indigenous-government disapproval, military/police power displays, community-business conflict, and school-related rejection—but lack corroborating detail on timing, location, scale, and source.
Recommendation: Corporate security teams should cross-reference these signals against real-time feeds from NSW Police, Victoria Police, Queensland Police media releases, and ABC News alerts to establish whether any have escalated to operational significance for your specific locations.
Highest-Risk Areas
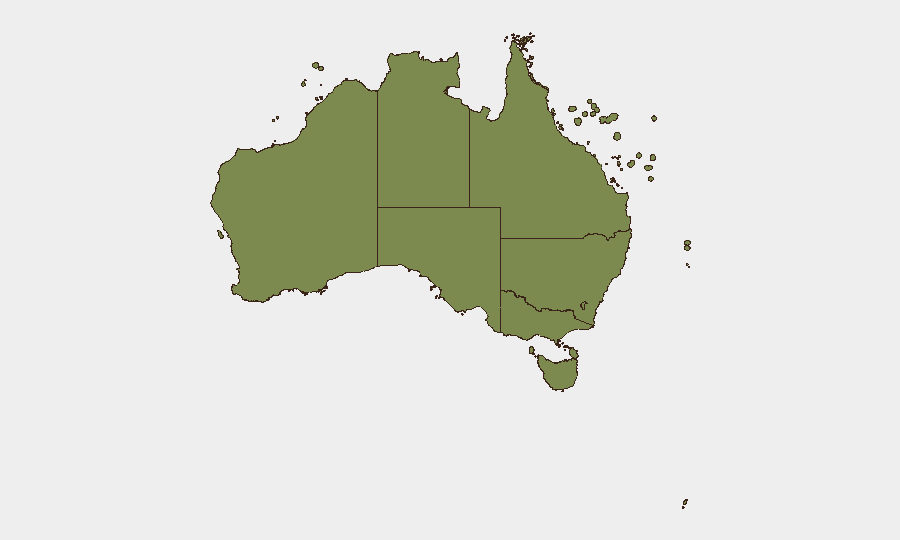
New South Wales (31.2) dominates the national risk profile and warrants primary monitoring focus; the score is more than 75% higher than Queensland's and reflects sustained event density over recent weeks. Queensland (17.7) follows, with Victoria (13.2) completing a top-three concentration in the eastern seaboard. Western Australia and the ACT remain secondary concerns (8.6 and 6.5 respectively), while regional territories and external territories present minimal corporate risk. The clustering suggests that operations in Sydney, Brisbane, and Melbourne metropolitan areas should maintain elevated situational awareness relative to other states.
How GeoBit Would Assist
AOI Monitoring & Early Warning would establish persistent surveillance of NSW and Queensland locations of interest (offices, facilities, event venues, transit hubs) with automated alerting for emerging civil unrest, protest activity, or security incidents. Intel Sweep and multi-language OSINT fusion (including X/Twitter, Telegram, and local news feeds) would provide real-time signal ingestion and corroboration to distinguish genuine escalations from noise. Network & Actor Analysis would map indigenous, government, and community-group positions to anticipate flashpoints and inform duty-of-care briefings for personnel in high-risk postcode areas.
7-Day Outlook
The 24–72-hour event velocity (6 distinct signal categories recorded on 2026-07-24 alone) suggests continued friction across indigenous relations, government legitimacy, and community-company tensions. No imminent state-level instability is signaled, but localized protest, media confrontation, and official rejection rhetoric will likely persist. Corporate teams should assume continued elevated baseline risk in NSW and Queensland through the week and prepare contingency comms and movement protocols for high-visibility personnel.
Next update: 2026-07-26 0700 AEST. Report operational incidents or requests for deep-dive analysis to your GeoBit account manager.
Highest-Risk Areas — Ranked
| # | State / Region | Risk |
|---|---|---|
| 1 | New South Wales | 31.2 |
| 2 | Queensland | 17.7 |
| 3 | Victoria | 13.2 |
| 4 | Western Australia | 8.6 |
| 5 | Australian Capital Territory | 6.5 |
| 6 | South Australia | 5.8 |
| 7 | Northern Territory | 4.4 |
| 8 | Tasmania | 1.9 |
| 9 | Ashmore and Cartier Islands | 1.2 |
| 10 | Jervis Bay Territory | 1.2 |
| 11 | Coral Sea Islands | 1.2 |
Sources
Previous Daily Briefs
A new Australia brief is written every day — each with its own risk map and downloadable CSV. Here's the last week; use the calendar to go further back.
📅 Browse every day by calendar →
Highlighted days have a brief. Tap a day for that day's map & analysis, or “csv” for that day's dataset ($5).
Atlas — our AI intelligence desk — emails them this snapshot personally. Nothing else, no list.