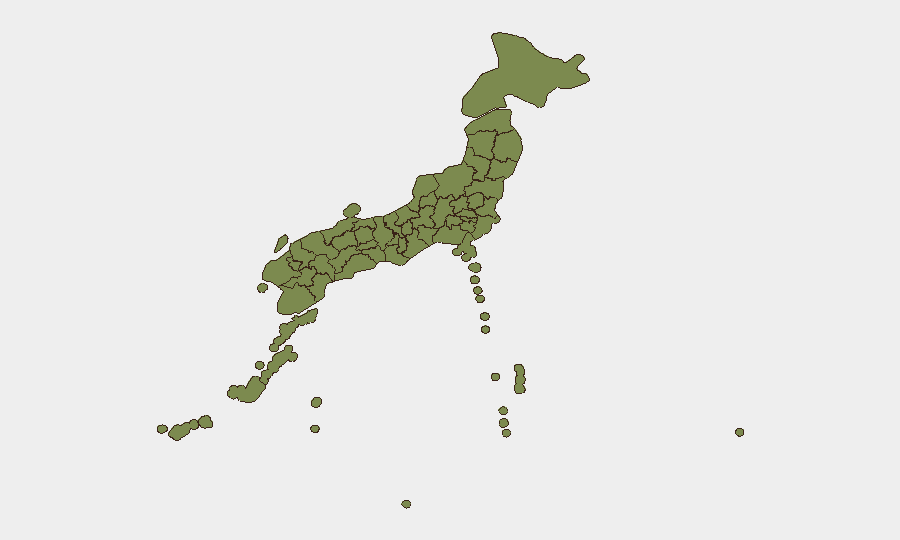
Situation Summary
Japan remains a low-threat environment globally (composite score 33; rank #null), but experiences concentrated volatility in Tokyo and surrounding Kanagawa Prefecture. Recent event signals include diplomatic friction (Jakarta disapproval of Japan, Chinese threats toward Japan), intelligence investigations, and isolated security incidents. The threat profile is stable but warrants close monitoring of Tokyo metro, cross-border tensions, and cyber activity.
Key Developments
- 2026-07-28 · China–Japan tension escalation: Chinese official threat statement directed at Japan; context includes reported Chinese destroyer live-fire activity in Japan's EEZ near Okinotorishima in late July (exact date unconfirmed in 24h window).
- 2026-07-28 · Armed incident at school: Small arms combat incident reported involving a Captain and a school location; geographic specifics and casualty status require confirmation.
- 2026-07-28 · Government statement: Official Japanese government response issued; nature and scope not specified in current signal data.
- 2026-07-27 · US–Japan business friction: US rejection of Japan-linked business initiative; escalation vector and sectors unclear from available signals.
- 2026-07-27 · Domestic investigation: Japanese intelligence services initiated investigation; subject matter unspecified.
- 2026-07-26 · Jakarta–Japan diplomatic disapproval: Indonesian official disapproval statement regarding Japan; underlying issue not detailed in signals.
*Note: Web research within the strict 24–48 hour window did not yield independently verified incident details beyond event signals. Older confirmed incidents (ransomware attack on Nichirei on 22 July, vehicle ramming in Sagamihara on 20 July, chemical spray at Osaka school on 17 July) provide relevant context for cyber and public safety risk but fall outside the current reporting window.*
Highest-Risk Areas
Tokyo dominates the risk landscape, accounting for a composite score of 30.8 of Japan's total 33—a stark concentration reflecting both the capital's role as a political, economic, and diplomatic hub and its exposure to cross-border tensions, intelligence activity, and criminal/security incidents. Kanagawa Prefecture (9.3) is the secondary concern, driven largely by proximity to Tokyo and recent violent crime (late-July ramming and blade incidents in Sagamihara). The remaining ten prefectures distribute the residual 3.2 risk points, with Hiroshima, Fukuoka, and Iwate each tracking low but measurable signals. This distribution suggests that duty-of-care focus should concentrate on greater Tokyo, while maintaining baseline awareness for port cities (Hiroshima, Fukuoka, Nagasaki) and diplomatic/military installations.
How GeoBit Would Assist
Intel Sweep and X/Telegram OSINT enable continuous monitoring of Japanese official statements, foreign diplomatic reactions, and emerging threats, surfacing signals days before mainstream media. AOI Monitoring & Early Warning with persistent geofencing around Tokyo, Kanagawa, and port facilities would detect escalations in Chinese maritime activity, ransomware campaigns targeting supply chains, or security incidents near corporate or expatriate concentrations. Network & Actor Analysis and Sentiment & Temporal Analysis would track regime stability, inter-agency frictions, and shifting threat actor intent, informing evacuation or movement decisions for personnel in high-risk prefectures.
7-Day Outlook
Near-term trajectory suggests stable but elevated diplomatic and cyber risk. The China–Japan tensions (live-fire drills, official threats) and domestic intelligence investigations may prompt tighter security protocols around government, defense, and energy sectors, with spillover effects on transportation and visa processing. Tokyo-metro security incidents appear episodic rather than sustained, but expatriate and corporate personnel should anticipate increased police presence and possible transport delays, particularly around central wards and transit hubs.
Highest-Risk Areas — Ranked
| # | State / Region | Risk |
|---|---|---|
| 1 | Tokyo | 30.8 |
| 2 | Kanagawa Prefecture | 9.3 |
| 3 | Hiroshima Prefecture | 5.4 |
| 4 | Fukuoka Prefecture | 3.6 |
| 5 | Iwate Prefecture | 2.9 |
| 6 | Yamagata Prefecture | 1.8 |
| 7 | Ibaraki Prefecture | 1.5 |
| 8 | Hokkaido Prefecture | 1.1 |
| 9 | Hyogo Prefecture | 1.1 |
| 10 | Kyoto Prefecture | 1.1 |
| 11 | Okinawa Prefecture | 0.8 |
| 12 | Nagasaki Prefecture | 0.8 |
Sources
Previous Daily Briefs
A new Japan brief is written every day — each with its own risk map and downloadable CSV. Here's the last week; use the calendar to go further back.
📅 Browse every day by calendar →
Highlighted days have a brief. Tap a day for that day's map & analysis, or “csv” for that day's dataset ($5).
Atlas — our AI intelligence desk — emails them this snapshot personally. Nothing else, no list.