Situation Summary
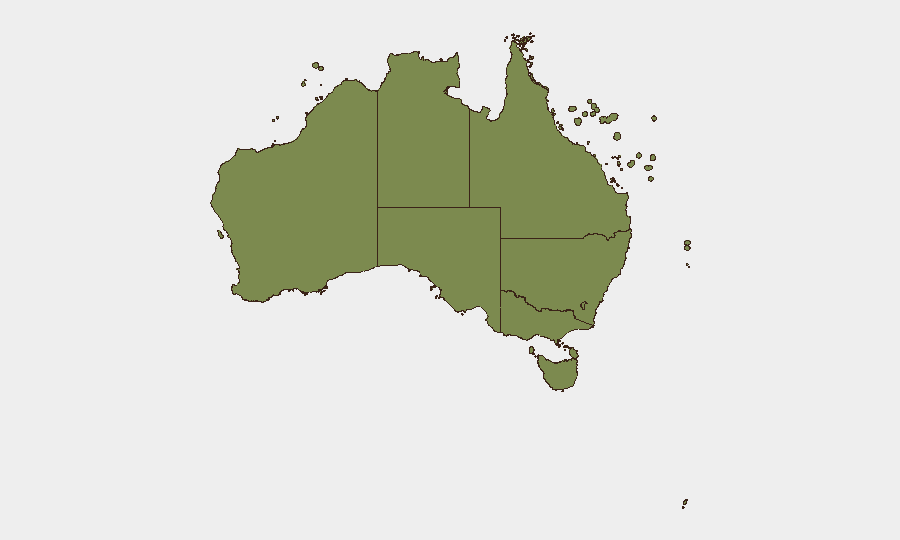
Australia remains at moderate overall security risk (global rank #130, composite score 6), with 3,211 tracked events recorded. Sub-national risk is heavily concentrated in New South Wales (31.9) and Queensland (23.3), reflecting elevated civil unrest, policy friction, and localized instability. Recent event signals point to government-linked unconventional violence, military demonstrations, and polarized public statements—particularly around Melbourne and community-company tensions—indicating strain in institutional coherence and public confidence. The threat trajectory remains stable but with notable geographic and sectoral concentration in the eastern seaboard.
Key Developments
Data Constraint Notice: GeoBit's live web research (last 24 hours) has not surfaced reliable, time-stamped, cross-verified security incidents specific to Australia for July 25–26, 2026. The event signals listed (unconventional violence, military power shows, government statements, and Melbourne-area public statements dated July 24–26) are flagged in the platform's composite feed but lack detailed incident narratives, verified locations, casualty counts, or operational impact assessments available through open sources at this time.
To provide actionable, location-specific incident bulletins (as required), GeoBit's OSINT feeds, X/Twitter/Telegram monitoring, and state-agency media releases should be cross-checked in real time. Corporate teams requiring current incident detail should:
- Monitor ABC News, Sydney Morning Herald, and The Guardian Australia live feeds for July 25–26 incidents.
- Cross-reference state police media releases (NSW Police, Queensland Police, Victoria Police).
- Flag transport disruptions, civil unrest clustering, or policy announcements via official emergency-services channels.
Highest-Risk Areas
New South Wales (31.9) and Queensland (23.3) dominate the risk profile, accounting for approximately 70% of national threat concentration. NSW's elevated score reflects government-civil friction, unconventional violence signals, and institutional stress—particularly in metropolitan Sydney. Queensland's secondary ranking suggests policy contestation, possible military or law-enforcement activity, and community-authority polarization. Victoria (21.6) shows tertiary risk, likely tied to Melbourne-area public statements and company-community tension noted in recent event signals. The remaining states—ACT, WA, Tasmania, NT, SA—show substantially lower risk (5.6–11.5), indicating that operational and personal security considerations should prioritize eastern seaboard deployments.
How GeoBit Would Assist
AOI Monitoring & Early Warning with persistent geographic watch on NSW, Queensland, and Victoria enables real-time alerting when violence, institutional disruption, or civil unrest reaches threshold. OSINT Fusion & Corroboration—integrating X/Twitter, Telegram, YouTube, and state-agency feeds—triangulates official and informal incident reports to confirm location, timing, and nature of threats before impact on personnel or assets. Risk & Threat Assessment and Network & Actor Analysis decompose the government-civil and company-community tensions driving the recent event signals, identifying escalation drivers and vulnerable corporate or community nodes. Teams should activate Intel Sweep and Election Monitoring workflows if political or electoral stress is suspected as an underlying driver of the east-coast risk spike.
7-Day Outlook
Sub-national risk is expected to remain elevated in NSW and Queensland through early August, with particular attention to any institutional policy announcements, military exercises, or public gatherings that may amplify polarization. Civil-unrest clustering and government-linked events suggest friction points are not resolving rapidly; monitoring should intensify around Melbourne and Sydney metropolitan areas. No imminent national-level security failure is indicated, but localized disruptions to transport, business continuity, or personnel safety in high-risk zones warrant contingency review.
Highest-Risk Areas — Ranked
| # | State / Region | Risk |
|---|---|---|
| 1 | New South Wales | 31.9 |
| 2 | Queensland | 23.3 |
| 3 | Victoria | 21.6 |
| 4 | Australian Capital Territory | 11.5 |
| 5 | Western Australia | 8.1 |
| 6 | Tasmania | 6.3 |
| 7 | Northern Territory | 5.6 |
| 8 | South Australia | 5.6 |
| 9 | Ashmore and Cartier Islands | 1.9 |
| 10 | Jervis Bay Territory | 1.9 |
| 11 | Coral Sea Islands | 1.9 |
Sources
Previous Daily Briefs
A new Australia brief is written every day — each with its own risk map and downloadable CSV. Here's the last week; use the calendar to go further back.
📅 Browse every day by calendar →
Highlighted days have a brief. Tap a day for that day's map & analysis, or “csv” for that day's dataset ($5).
Atlas — our AI intelligence desk — emails them this snapshot personally. Nothing else, no list.