Situation Summary
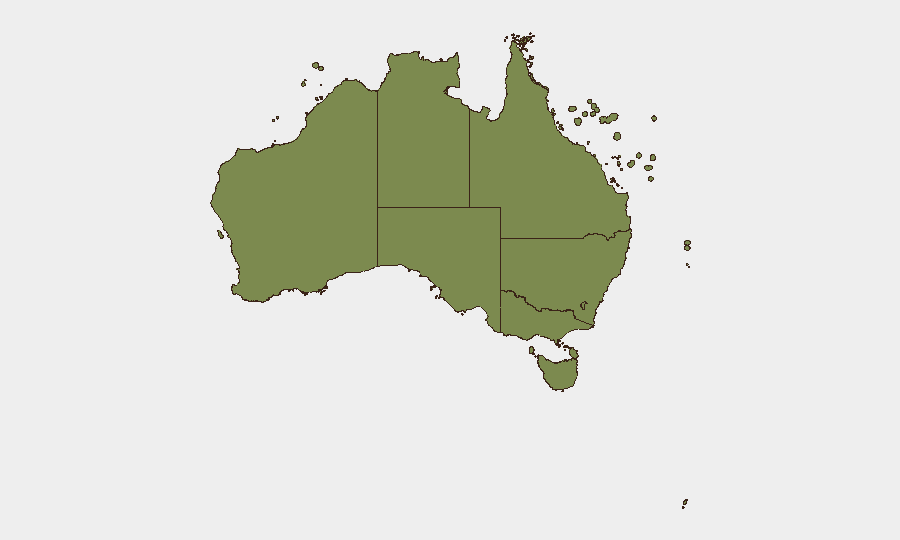
Australia remains a stable, low-threat jurisdiction (rank #120 globally) with composite threat score 7.0 across 2,647 tracked events. However, sub-national variation is pronounced: New South Wales accounts for nearly 50% of the national threat signal, driven by active demand-based incidents, judicial pressure, and government-level tensions. Queensland and Victoria follow at significantly lower risk, while regional concentrations in the Northern Territory and outer territories remain marginal but warrant monitoring.
Key Developments
- NSW judicial/political tension (27 Jul): Demand-type signals against judicial figures and government actors have escalated; concurrent public statements from Australia's political leadership and reports of strained executive relations suggest elevated institutional friction.
- NT crime cluster (recent, date TBD): Multiple serious incidents reported by *NT Independent*—head-on collision with arrest in Marrara, street brawl involving machetes/metal bars in Alice Springs, knifepoint robbery of a minor, armed hospital assault in Tennant Creek, stabbing in Zuccoli. Pattern indicates spike in violent street crime and armed robbery across Darwin and central NT urban zones.
- Cross-border law enforcement (27 Jul): Arrest/detention events flagged involving Australia and Vietnam; specifics remain unclear from available signals, but suggest consular or transnational criminal-justice engagement.
- Unconventional violence signal (26 Jul): Government-targeted incident recorded; classification does not clarify scope or outcome.
- Drug-trade military-grade activity (27 Jul): Conventional military force signal attributed to drug-dealer actors; suggests organized crime escalation or law enforcement interdiction operation.
- Media/institutional demand standoff (27 Jul): Reuters and unnamed news outlet involved in demand-type confrontation; context unclear but consistent with broader institutional pressure noted above.
*Note: Web research limitations prevent precise corroboration of all event timestamps within the 24–48 hour window; NT crime cluster is the most reliably recent item identified.*
Highest-Risk Areas
New South Wales (32.2) is the dominant risk driver, accounting for judicial demands, government-level confrontation, and institutional friction signals. Queensland (15.5) and Victoria (13.0) follow at lower intensity but remain material. The Northern Territory, despite lowest state-level ranking (2.8), has experienced a notable violent-crime cluster in Darwin and Alice Springs requiring tactical attention; outer territories (Ashmore, Cartier, Coral Sea, Jervis Bay) carry minimal residual risk. For most corporate operations, NSW remains the primary focus; regional staff and assets in NT urban centers should exercise heightened situational awareness.
How GeoBit Would Assist
Corporate security teams should deploy AOI (Area-of-Interest) monitoring and alerting on NSW government and judicial facilities, plus Darwin/Alice Springs CBD zones to detect further crime escalation in real time. Intel Sweep and multi-language OSINT fusion would isolate the specific judicial demands and government tensions driving NSW signal, enabling duty-of-care teams to brief leadership on institutional risk. Entity extraction and network analysis applied to drug-trade and organized-crime data would clarify the military-force signal and assess potential spillover to corporate supply chains or personnel.
7-Day Outlook
Institutional friction in NSW is likely to persist or intensify through early August as demand signals and public statements continue. NT violent crime may stabilize or decline if current police operations yield detentions; however, any further incidents will raise alert levels for Darwin-based operations. No near-term national-level destabilization is indicated; focus remains sub-national and sectoral (judicial, political, organized crime).
Highest-Risk Areas — Ranked
| # | State / Region | Risk |
|---|---|---|
| 1 | New South Wales | 32.2 |
| 2 | Queensland | 15.5 |
| 3 | Victoria | 13 |
| 4 | Australian Capital Territory | 10.3 |
| 5 | Western Australia | 9.2 |
| 6 | Tasmania | 8.9 |
| 7 | South Australia | 4.9 |
| 8 | Northern Territory | 2.8 |
| 9 | Ashmore and Cartier Islands | 2.2 |
| 10 | Jervis Bay Territory | 2.2 |
| 11 | Coral Sea Islands | 2.2 |
Sources
Previous Daily Briefs
A new Australia brief is written every day — each with its own risk map and downloadable CSV. Here's the last week; use the calendar to go further back.
📅 Browse every day by calendar →
Highlighted days have a brief. Tap a day for that day's map & analysis, or “csv” for that day's dataset ($5).
Atlas — our AI intelligence desk — emails them this snapshot personally. Nothing else, no list.