Situation Summary
Australia's overall security posture remains stable, with a composite threat score of 17 placing the country in the lower-risk global tier. However, sub-national risk concentration in New South Wales (31.1) and Victoria (12.5) reflects elevated activity in major urban and institutional centers. Recent event signals indicate scattered tensions across judicial, religious, media, and law-enforcement domains, with a significant cyber incident affecting critical national infrastructure overlaying the broader threat picture.
Key Developments
- Origin Energy Cyber Breach (Australia-wide, 23 Jul 2026): Unauthorized access to customer data confirmed; 900,000 current and former customers notified of exposure. Represents a material compromise of critical national infrastructure and customer personal information at scale.
- Melbourne Physical Assault (28 Jul 2026): Incident reported in Victoria's capital; details remain under investigation but flagged in law-enforcement monitoring.
- Canberra Investigation Activity (28 Jul 2026): Federal capital area showing investigative signals; suggests active inquiry into matter(s) of concern to national authorities.
- Judicial & Legal System Signals (27–28 Jul 2026): Multiple events tagged to judges, lawyers, and supreme court actors, including demands and rejections; suggests institutional friction or high-profile proceedings.
- Radio/Media Statement Activity (28 Jul 2026): Public statements attributed to media figures and police; consistent with high-profile incident communication or public advisory cycles.
- Religious Tension Signals (27–28 Jul 2026): Public statements and activity flagged under Muslim and Rabbi categories; no confirmed violent incidents, but indicates community-level discourse or grievance amplification.
Highest-Risk Areas
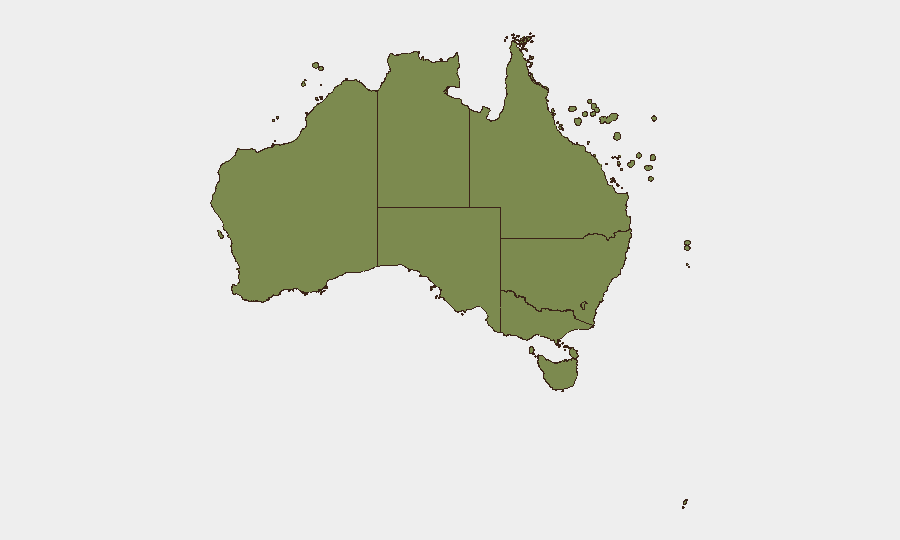
New South Wales is the primary risk driver, with a score more than double Victoria's and accounting for the majority of recent tracked events. Sydney's size, institutional density (courts, media, federal agencies), and the Origin Energy breach footprint all contribute. Victoria follows at 12.5, primarily driven by Melbourne-based incidents including the 28 July physical assault and ongoing investigative activity. Australian Capital Territory (6.5) reflects concentrated national-government and intelligence activity in Canberra. The remaining states show minimal immediate threat signals, with remote territories (NT, Ashmore, Jervis Bay, Coral Sea Islands) at negligible risk.
How GeoBit Would Assist
Security teams should deploy AOI Monitoring & Early Warning on Sydney and Melbourne postcodes to detect emerging civil unrest, infrastructure incidents, or institutional disruptions in real time. Intel Sweep and multi-language OSINT fusion would correlate the scattered religious and judicial signals to assess whether isolated statements represent organized coordination or isolated community friction. Cyber incident tracking and network analysis capabilities should be applied continuously to monitor Origin Energy's remediation progress and detect secondary intrusions or data-market activity linked to the breach.
7-Day Outlook
The trend remains stable but fragmented; no imminent escalation to widespread civil unrest or critical-infrastructure failure is evident. However, the Origin Energy breach's ongoing impact on consumer confidence and regulatory scrutiny will likely sustain media and political attention through early August. Judicial and religious signals should be monitored for coalescence into larger grievance clusters, particularly if Melbourne or Sydney incidents spike.
Highest-Risk Areas — Ranked
| # | State / Region | Risk |
|---|---|---|
| 1 | New South Wales | 31.1 |
| 2 | Victoria | 12.5 |
| 3 | Australian Capital Territory | 6.5 |
| 4 | Western Australia | 5.9 |
| 5 | Queensland | 5.5 |
| 6 | Tasmania | 3.8 |
| 7 | South Australia | 3.4 |
| 8 | Northern Territory | 1.4 |
| 9 | Ashmore and Cartier Islands | 1 |
| 10 | Jervis Bay Territory | 1 |
| 11 | Coral Sea Islands | 1 |
Sources
Previous Daily Briefs
A new Australia brief is written every day — each with its own risk map and downloadable CSV. Here's the last week; use the calendar to go further back.
📅 Browse every day by calendar →
Highlighted days have a brief. Tap a day for that day's map & analysis, or “csv” for that day's dataset ($5).
Atlas — our AI intelligence desk — emails them this snapshot personally. Nothing else, no list.