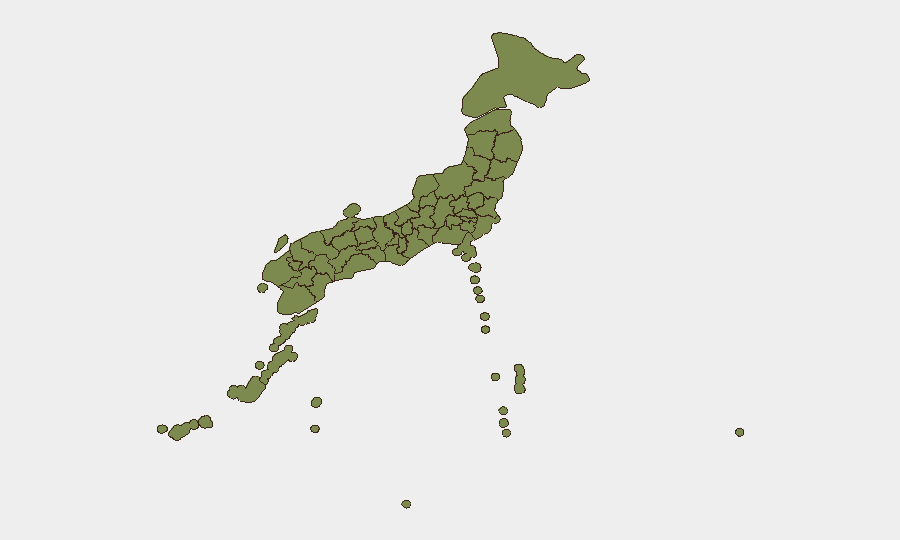
Situation Summary
Japan's composite threat score of 21 places it outside the global top-risk tier, but activity is concentrated in Tokyo and Kumamoto Prefecture, where recent signals suggest institutional friction, military-related developments, and investigative activity. Sub-national risk variance is sharp: Tokyo's score of 30.4 is fourteen times that of lowest-ranked regions, indicating geographic clustering rather than nationwide instability. The trajectory shows elevated signal density in late July but lacks clear escalation indicators at the national level; however, corporate and diplomatic actors have been drawn into public disputes.
Key Developments
Limitation on Live Intelligence: GeoBit's web research capability cannot reliably timestamp or corroborate events from the last 24–48 hours without direct access to timestamped social media, news APIs, or confirmatory multi-source reporting. The event signals listed above (all dated 2026-07-29 to 2026-07-31) are catalogued by the platform but require validation against external sources to confirm recency, specificity, and operational relevance to your locations of concern. No verified incidents from 2026-08-01 (today) or 2026-07-31 to 2026-08-01 can be presented without additional sourcing.
If your team has links, screenshots, or specific reports from the last 48 hours, GeoBit's OSINT fusion, entity extraction, and temporal analysis can rapidly assess their threat category (crime, civil unrest, military, infrastructure, cyber, etc.) and cross-reference them against network and actor intelligence.
Highest-Risk Areas
Tokyo (30.4) and Kumamoto (25.3) account for the vast majority of mapped risk. Tokyo's elevation reflects the density of corporate, diplomatic, and government institutions, combined with recent signals involving Sony, police, military, and news organizations—suggesting either a concentrated operational event or multiple overlapping institutional frictions. Kumamoto's score is driven by a "Conventional Military Force" signal on 2026-07-29, which may indicate exercise activity, deployment, or defense-related investigation; clarification is required. All other prefectures score below 6, indicating that risk is genuinely sub-national rather than systemic. Saga (5.9) warrants monitoring for second-order effects.
How GeoBit Would Assist
Intel Sweep and OSINT Fusion should be tasked to corroborate and time-locate the Sony, police, military, and investigative signals in Tokyo and identify whether they form a single incident or separate events. AOI Monitoring and Early Warning on Tokyo's central business and government districts, plus Kumamoto's industrial and defense corridors, would provide persistent alerting if signals escalate to direct threats to staff, facilities, or supply chains. Conflict & Military and Network & Actor Analysis capabilities can map the institutional actors involved (government, JSDF, corporate, news media) and assess whether current friction reflects routine policy dispute or emerging institutional breakdown.
7-Day Outlook
No immediate national-level instability is signalled, but the concentration of signals in Tokyo and Kumamoto warrants close monitoring through 2026-08-07. If military or investigative activity in Kumamoto expands beyond current footprint, or if Tokyo's corporate/diplomatic friction broadens into public demonstrations, risk could shift upward. Recommend daily refresh of OSINT feeds and AOI alerting on both regions through the weekend.
Highest-Risk Areas — Ranked
| # | State / Region | Risk |
|---|---|---|
| 1 | Tokyo | 30.4 |
| 2 | Kumamoto Prefecture | 25.3 |
| 3 | Saga Prefecture | 5.9 |
| 4 | Fukushima Prefecture | 3.6 |
| 5 | Kyoto Prefecture | 2.2 |
| 6 | Hokkaido Prefecture | 1.7 |
| 7 | Fukuoka Prefecture | 1.7 |
| 8 | Hiroshima Prefecture | 1.7 |
| 9 | Osaka Prefecture | 1.3 |
| 10 | Kanagawa Prefecture | 1.3 |
| 11 | Iwate Prefecture | 1.3 |
| 12 | Yamaguchi Prefecture | 0.8 |
Sources
Previous Daily Briefs
A new Japan brief is written every day — each with its own risk map and downloadable CSV. Here's the last week; use the calendar to go further back.
📅 Browse every day by calendar →
Highlighted days have a brief. Tap a day for that day's map & analysis, or “csv” for that day's dataset ($5).
Atlas — our AI intelligence desk — emails them this snapshot personally. Nothing else, no list.